Unleashing the world's imagination and ideas across the analogue/ digital divide
Our history
In 1996, a young Swede, Christer Fåhræus was writing his doctorate when he had a bold idea. He envisioned using a high-tech pen that could help him get all his paperwork done more efficiently. During the decade that followed, his concept was transformed into the world’s first digital pen as well as the global de facto standard for digital pen & paper technology. The Anoto Group was initially founded as C Technologies in 1996 to realize Fåhræus’s technological idea, and then in 1999, after several key mergers and partnerships had been formed the Anoto Group was established. The following year, in 2000, Anoto Group AB was listed on the Stockholm Stock Exchange, where it still remains on the Small Cap list of Nasdaq Stockholm under the ticker ANOT.
Our vision
At Anoto, we believe it’s our expression of imagination and ideas that sets us apart as humans. For Millennia we’ve used writing tools to communicate and express our thoughts and ideas. Learning to write and draw with ink on paper has been handed down from generation to generation, but in an increasingly digital world this practice is dying. And that’s because what we write and draw with ink on paper is trapped in an analogue world. All those imaginative thoughts and ideas, that we’ve expressed and committed to pen and paper are simply locked up in our real, physical world unable to be used or shared in our digital world. That’s why we exist – to unlock this handwritten world trapped in ink on paper and make it useful in our digital lives today. We’ve made and designed digital smartpens and innovative writing solutions for over 20 years, so we’re applying this experience to drive a new vision – unleashing the world’s imagination and ideas across the analogue/ digital divide.
Our mission
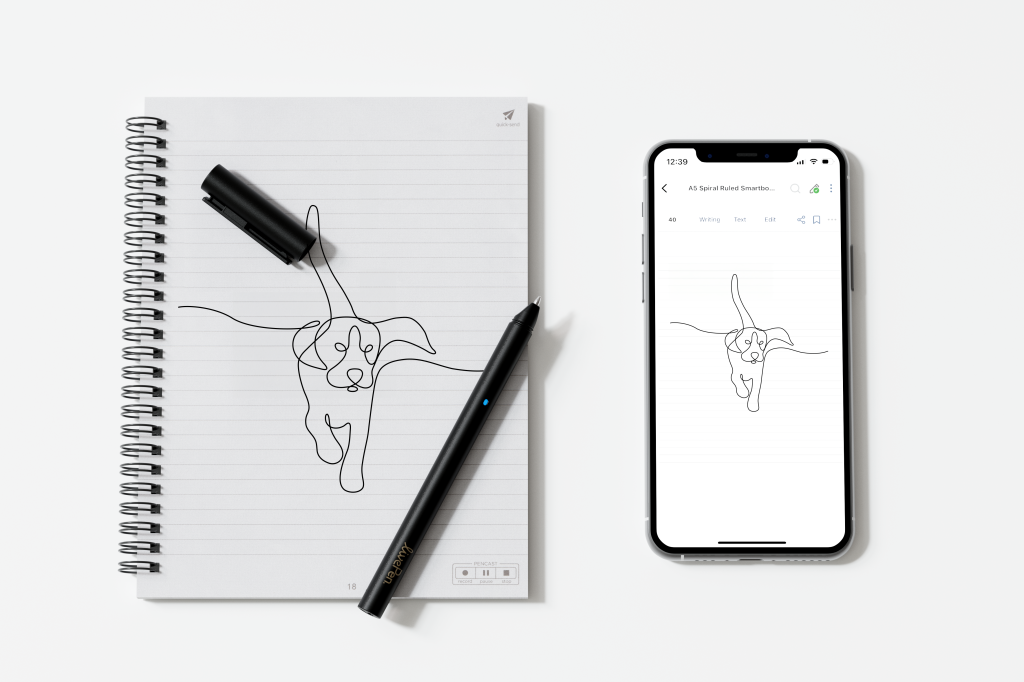
Our mission is to instantly bring the handwritten world to digital life. So whatever thoughts and imaginative ideas you have, whatever you write or draw with your pen in ink on paper, is immediately and simultaneously captured on your digital devices for you to use and share.
The handwritten world
The handwritten world made with ink on paper is a magical place of thoughts, imagination and ideas. Written or drawn, then scribbled out and refined. It’s a world where emotion and attitude are captured in ink, pen stroke and pressure. It’s just not the same as writing on glass or plastic. Paper is uneven. The way ink flows across the paper is uneven. It’s a far more tactile, sensorial experience than using a digital stylus. However, unlike digitally captured expressions, the handwritten world has become a fragile one where ideas captured in a moment on paper can be lost, misplaced or forgotten.
Consequently, typing over handwriting has increasingly become the preferred method of communication for many. But, what if we could find a way to make the handwritten world more useful in a digital age, make it instantly available to use and share. We would not only make handwriting more modern, but also unleash thoughts, imagination and ideas that would otherwise be trapped in an analog world. The art of writing is what makes us human and research is revealing that the benefits of handwriting are far reaching both in terms of improved learning ability and mental wellness. The handwritten world is something to nourish and preserve and we intend to keep it that way.